Customizable Sales Dashboard
Main Menu > Reports > Sales Dashboard (New) > Customizable Sales Dashboard
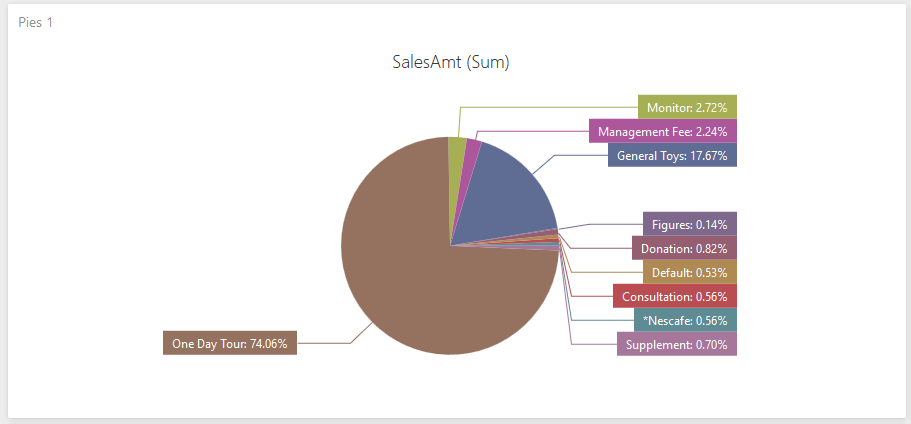
For example: Total sales amount and proportion of goods in all categories from June to September 2019
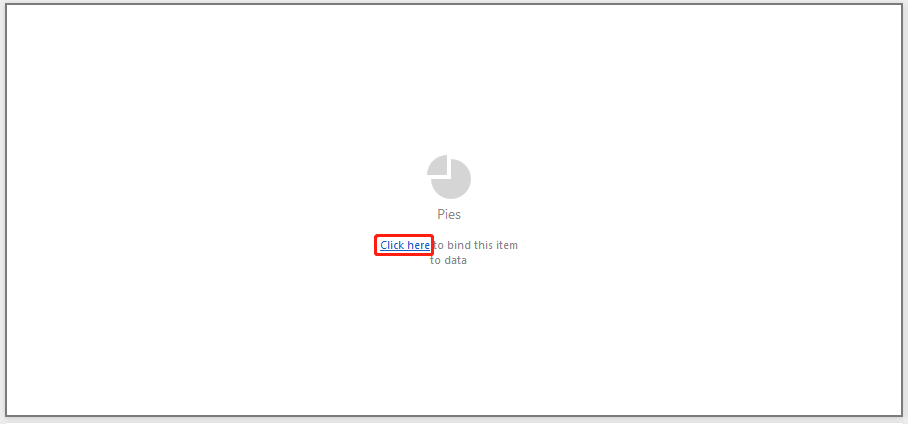
- If you want to create a new item, you can select "Edit in Designer"

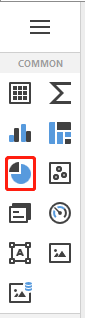
- Choose "COMMON". e.g.:Pies
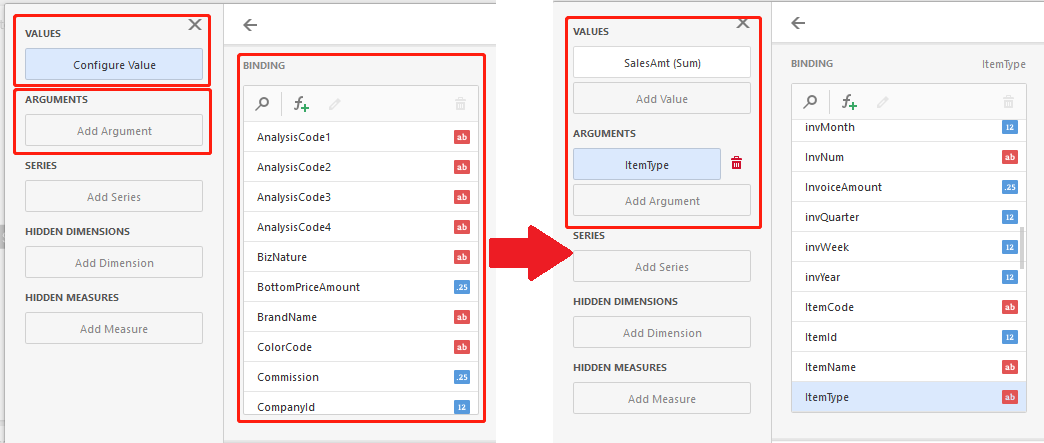
- Data fields: Click this and it will show below "Binding", you can drop any fields to different areas ( "Values", "Arguments"...etc.) for data analysis.
- Done.
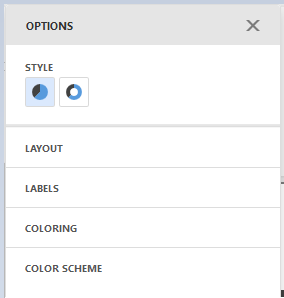
- Click "Option". (customize the detail of COMMON)
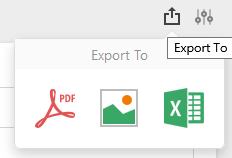
- Select "Export to", then can choose PDF / JPG / PNG / GIF / EXCEL.