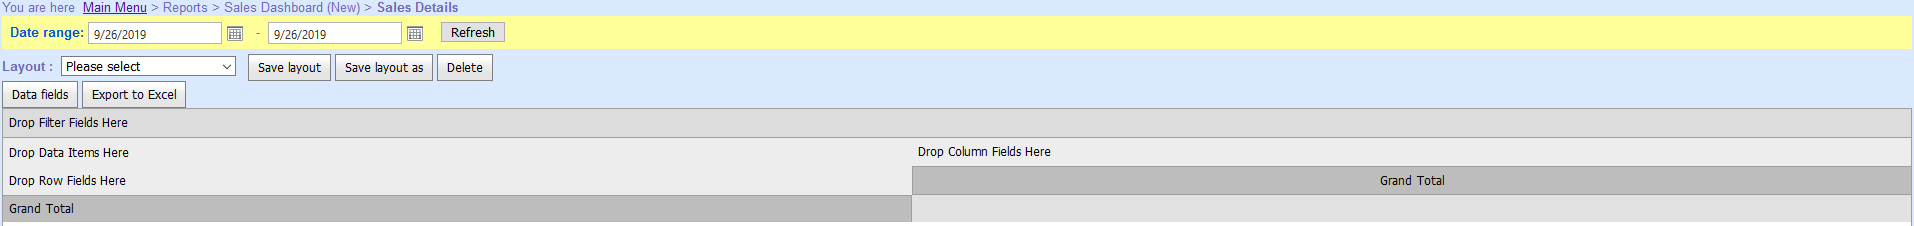
Sales Details
Main Menu > Reports > Sales Dashboard (New) > Sales Details
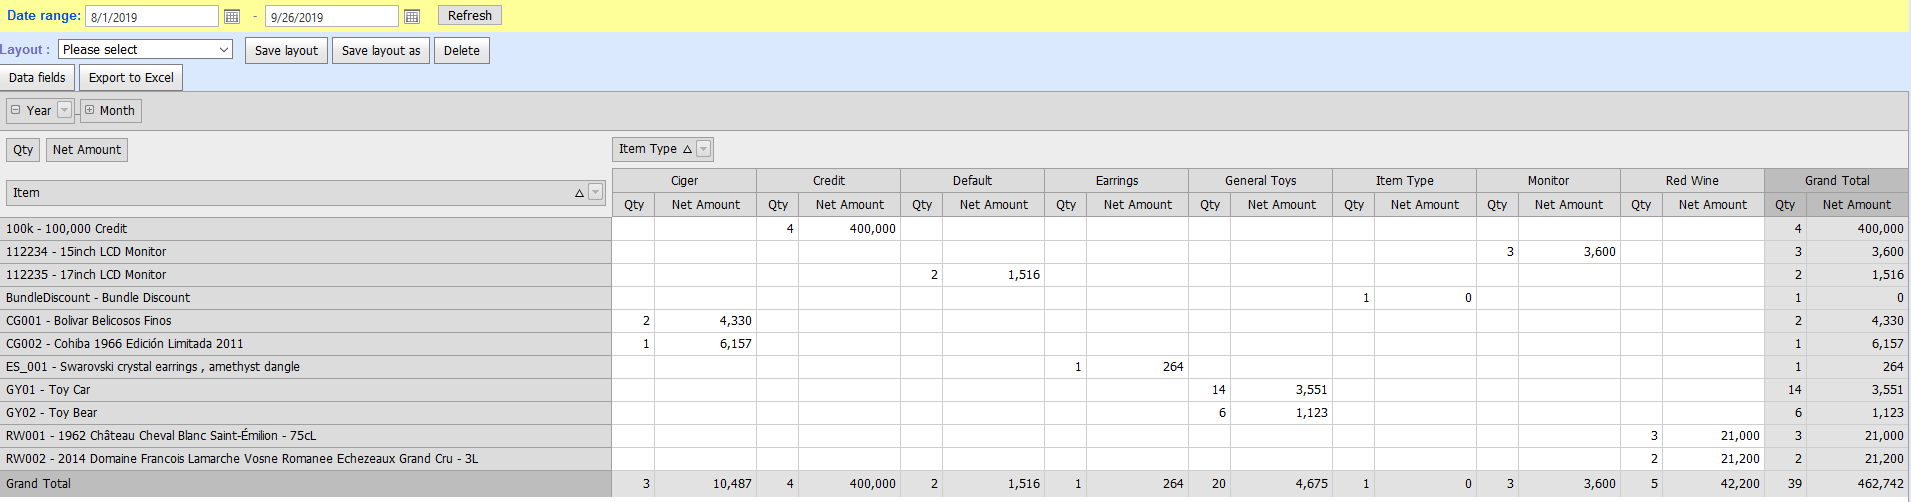
- A new Sales report generate for data analysis.
- Date range: Fill the date range, system will gather all data from this date range for your sales analysis
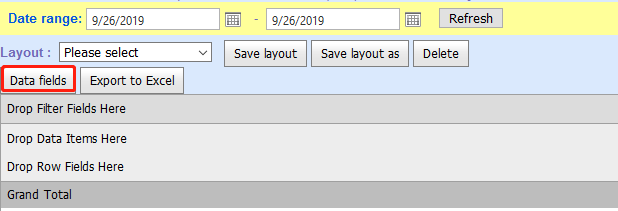
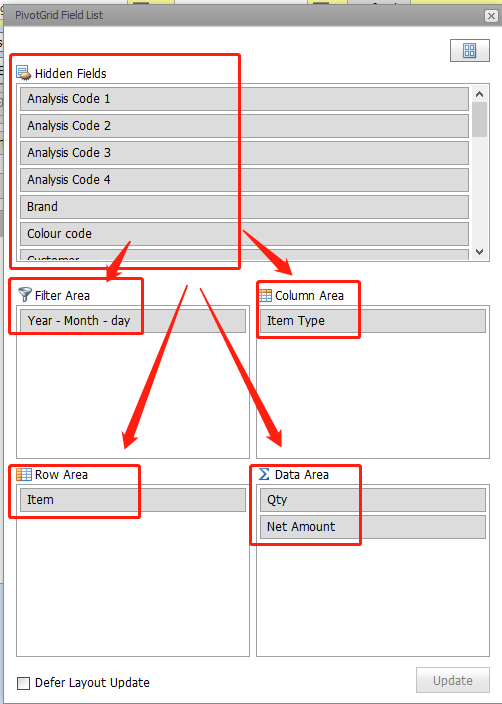
- Data fields: Click this and it will show below "PivotGrid Field List", you can drop any fields to different areas for data analysis.
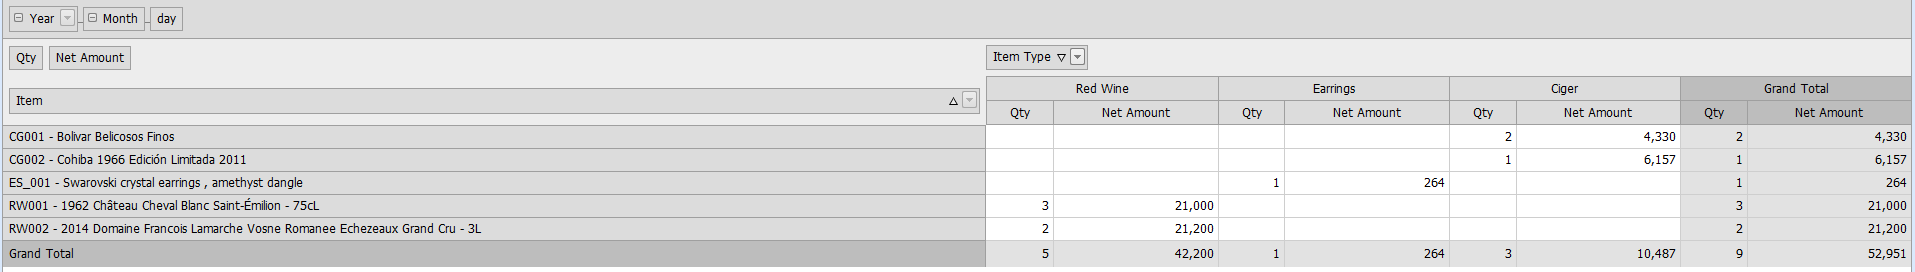
- For example: The sales Details of red-wine / cigar in August and September 2019 (by year - month - day)
Step:
- Select "Data fields".
- Select the data and items to be analyzed in the list.
- Close the window of "Data fields", select "Date range" and click "Refresh"
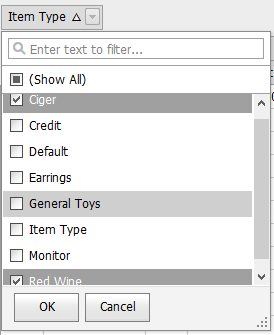
- Filter the "Item Type" > Red-wine & Cigar
- Done.
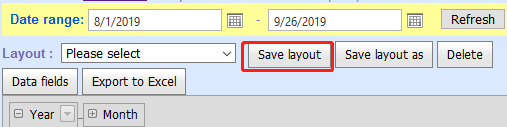
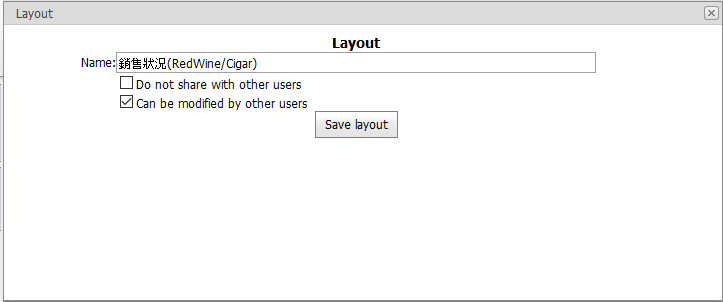
- Save layout (can be directly selected next time.)
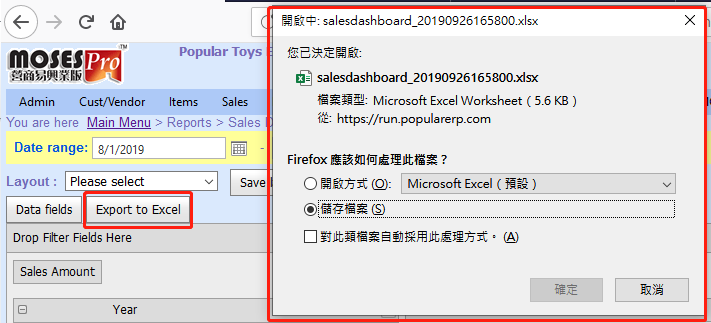
- Export to Excel